Email Marketing Campaigns
Email Marketing Analytics and Reporting
Track opens, clicks, and conversions with advanced analytics and reporting tools. Optimize email performance and maximize ROI with data-driven insights.
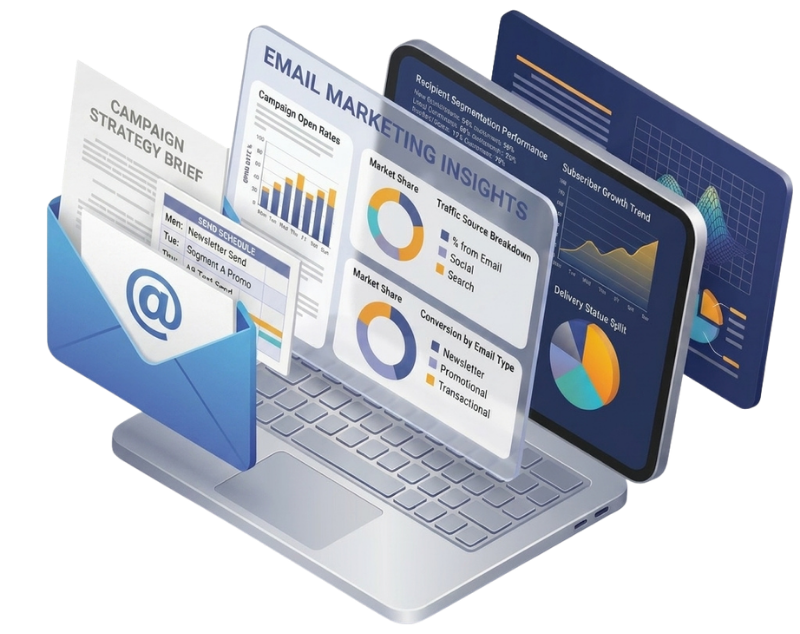
Track opens, clicks, and conversions with advanced analytics and reporting tools. Optimize email performance and maximize ROI with data-driven insights.
You send emails; subscribers open them; some click through, and some purchase. But what does it all signify? You cannot get the numbers from your gut feeling. When you measure the right metrics and know how to interpret them, you stop guessing at what works and can make decisions based on evidence.
Email marketing analytics turns raw data into clarity and actionable insights. You will learn which campaigns are driving revenue, which subject lines are being ignored, and which segments are worth your time.
At ASP OL Media, we track, analyse, and report on email marketing performance so you know what your campaigns are accomplishing—no vanity metrics, no fuzzy summary to hide poor performance. You only get transparent reporting to help you make better decisions.

Most businesses send emails and don’t know what happens next. They see an open rate and think everything is fine. Or they see fewer clicks and panic, not knowing why.
Analytics show you the full picture. A 25% open rate sounds pretty good until you realise your industry average is 40%. A 2% click rate may sound low, but if those clicks convert at 15%, then that campaign just made money. Context matters, and analytics provide it.
Data also shows patterns you would not otherwise see. Maybe your Tuesdays always trump your Thursdays. Maybe emails that ask a question in the subject line get opened more than emails that make a statement. One segment might have highly engaged subscribers, while another might ignore everything. These patterns are not visible when you are looking at individual campaigns. You need to aggregate data over time.
Analytics also justify marketing budgets. Once you can prove that email marketing produced a certain amount of revenue for a certain cost, you stop defending your budget and start growing it. Numbers do the convincing for you.
Open rate is the percentage of your subscribers who opened your email compared to how many received it. This metric shows how effective your subject lines are and whether your sender name is recognizable and trustworthy.
There are typically three issues that result in low open rates. Your subject lines are boring or unclear. Your sender name is unknown to subscribers. Or you are ending up in spam folders. We identify the problem and fix it.
Open rates have limitations. Apple Mail Privacy Protection and similar features make open tracking less reliable than it used to be. Someone might open your email without it registering. That does not mean open rates are useless, but it does mean we look at them alongside other metrics rather than in isolation.
Click-through rate is the number of people who clicked a link in your email. This metric is a good indicator of how compelling your content and offer are in getting people to act.
High open rates, low click rates? Your subject line was a winner, but your email content did not deliver. The offer may have been feeble. Perhaps the call to action was not clear. Or the body of the email was not interesting enough to click.
We measure not only the aggregate click rates but also the links clicked. If your mail call to action is ignored by everyone, but they click on a secondary link, that tells us something important about what your audience really wants.
Conversion rate measures how many people clicked and then did what you want them to do. This could be making a purchase, filling in a form, registering for an event, or downloading a resource.
Conversions, that’s what actually counts. Opens and clicks are a means to an end. The end is getting your subscribers to do something that helps your business. We track conversions for each campaign so you know which emails are driving real results, not just engagement.
Sometimes emails have great open and click rates, but terrible conversion rates. The problem is usually the landing page, not the email. We identify where the breakdown occurs so you can fix the right problem.
The bounce rate indicates how many emails did not arrive at the intended recipient. Hard bounces occur when an email address is invalid or does not exist. Soft bounces are temporary issues, such as an inbox being full or a server problem.
High bounce rates damage your sender's reputation and cost you money. We monitor bounce rates closely and regularly clean your email list to keep this number down. You can increase deliverability and only pay to reach real people by removing invalid addresses.
The unsubscribe rate shows how many people have decided to unsubscribe after receiving an email. Some unsubscribes are inevitable, and some are good. People change jobs, lose interest, clean out their inboxes, etc.; that’s normal.
But sudden spikes in unsubscribe rates are a red flag. Maybe you are sending too often. Maybe the content simply was not relevant anymore. Or a recent campaign fell flat on its face. We look at spikes to see what went wrong and modify future campaigns accordingly.
Spam complaint rate is the number of subscribers who marked your email as spam. This is a massive metric because if you have high complaint rates, it destroys your sender reputation and gets your domain blacklisted.
The complaint rate of 0.1% is way too high. We try to keep complaints as close to zero as possible by sending relevant content to people who want it, making unsubscribe links easy to find, and keeping our permission-based lists clean.
The list growth rate is the rate at which your email list is growing. You want to see growth over time. Stagnant or shrinking lists are signs of issues with your lead generation strategy or high churn rates.
We calculate net growth, which factors in new subscribers, fewer unsubscribes, and fewer bounces. If you only count new signups, you might see your list growing, but if you are losing subscribers as fast as you are gaining them, you are not growing; you are just standing still.
Revenue per email is calculated by dividing a campaign’s total revenue by the number of emails sent. This metric demonstrates the direct financial effect of your email marketing.
Some campaigns generate immediate revenue. Others grow leads that will convert later. We track assisted conversions and direct attribution so you can get the full picture of the revenue. Email marketing seldom operates in a vacuum, and good analytics know that.
Engagement measures changes in subscriber behavior over time as they remain on your list. New subscribers may be highly engaged at first and then taper off. Or trust may blossom and engagement increase. If you know these trends, you can tailor your approach for different levels of subscribers.
We segment engagement by cohorts. Subscribers who joined in January might behave differently from subscribers who joined in June. Track cohorts to see if your acquisition strategy is bringing in quality subscribers or just filling your list with low-value contacts.
After sending a campaign, you get a report with key performance indicators, such as open rate, click rate, conversions, and revenue. We compare these numbers to your historical performance and industry benchmarks so you can see if the campaign was successful or underperformed.
We also highlight wins and losses in specific cases. If a variation on a subject line crushed the control, you know you’ll use that method again. If a segment was completely unresponsive, we diagnose why and adjust targeting.
Monthly reports provide an overview of performance across all campaigns. Overall engagement rates, revenue generated, list growth, and total emails sent. These summaries capture trends that individual campaign reports do not capture.
We break down performance by the type of campaign. Marketing emails could be better than newsletters. Automated sequences could be more engaging than one-off broadcasts. Understanding which campaign types work best will help you spend your resources wisely.
Not all subscribers are the same. Some segments are deeply involved, while others barely open anything. We break down performance so you know which audiences need more love and which need better targeting or re-engagement efforts.
Segment analysis also shows opportunities. Perhaps one segment has high engagement but a low conversion rate. That means the audience is interested, but the offer is not the right one for them. We spot these mismatches and propose solutions.
We record the results and analysis behind every A/B test we do. Which variation won, by how much, and what that means for your audience. We collect data from tests over time to build a knowledge base of what works for your specific subscribers.
Testing only has value if you act on the results. We turn test results into action items that make future campaigns better. When three tests in a row show questions in subject lines beating statements, we change our strategy.
Revenue attribution connects email campaigns to real sales. We track the emails that led to purchases, the revenue each campaign generated, and the return on investment.
Attribution becomes complicated when consumers engage with several touchpoints prior to buying. We use first-touch and last-touch attribution models, and, where appropriate, multi-touch attribution to give you a full picture of how email contributes to revenue.
If a segment consistently ignores emails, we dig into why. Are they getting irrelevant stuff? Did they get on your list for other reasons than we thought? Have their needs evolved?
Sometimes segments just need to be better targeted. Sometimes, re-engagement campaigns are needed. And sometimes we propose to cut out unengaged parts altogether. Dead weight on your list hurts deliverability and burns budget.
Analytics show the best times for your audience to open and engage with emails. We test the send times and monitor performance by day of the week and time of day. Once we find the right windows, we plan campaigns accordingly.
Send time optimization is not a one-size-fits-all endeavor. B2B audiences behave differently from B2C. Your specific subscribers might have unique patterns. We find what works for your list, not what works on average across all industries.
Subject line performance data reveals which approaches work well for your audience. Are they a fan of questions or statements? Long or short? Curiosity-driven or benefit-driven? We track trends and incorporate them into future campaigns.
We also point out mistakes to avoid in subject lines. When emoji subject lines don’t work, we stop using them. We avoid words that are linked with low open rates. Negative data is as useful as positive data.
Click maps show you exactly where your subscribers are clicking in your emails. If everyone is scrolling past your main offer and clicking some random link at the bottom, then you need to work on your content structure. If you see nobody clicking images but they are clicking text links, you know you need to focus on text.
You can see in the heatmap data what actually grabs attention and what is ignored. We use this information to re-sequence emails, re-design layouts, and rewrite copy that is not performing.
Each campaign is a learning opportunity. We do controlled testing, measure results, and apply findings to future sends. Little improvements add up over time to produce big performance gains.
We test one variable at a time, so the results are obvious. Subject line tests change only the subject line. Content tests keep all other things constant. This discipline means we know exactly what drove changes in performance.

When you work with ASP OL Media, you get more than a report full of numbers. You get an analysis that tells you what the numbers mean. So why did this campaign perform better than the last? What does the decline in click rates really mean? We connect data to strategy so you get the story behind the numbers.
Recommendations are data-driven. If it is not working, we will tell you how to fix it. If something works really well, we tell you how to do more of it. Data without action items is wasted potential.
You get transparent reporting that doesn’t bury bad news. We expose when campaigns are not performing, tell you why, and give you solutions when they are not. Honesty creates trust, and trust leads to better long-term outcomes.
You get regular check-ins to review performance and adjust strategy. Analytics is not set-it-and-forget-it. It must be constantly observed, interpreted, and adapted to changing circumstances.

Most businesses make the same predictable mistakes with email analytics. We fix them.
Focusing solely on open rates misses the point: conversions and revenue really count. Opens are beginnings, not conclusions. We care about the metrics that matter to your bottom line.
Looking at campaign-level data without looking at trends over time misses the bigger picture. One bad campaign is not a crisis. Three months of declining engagement is a trend that needs correction. We pick up trends that you do not get in single campaign reports.
Ignore deliverability metrics until it is too late, and you will have serious issues. If you are seeing a deliverability problem, your sender reputation is already damaged. We constantly monitor deliverability and identify problems early.
Not segmenting performance data means you are treating all subscribers the same, even though they behave differently. Segmented analysis identifies which audiences drive results and which require different approaches.
If you measure metrics but don’t act on them, you have wasted the whole point of analytics. Data only matters if it changes your behaviour. We convert insights into action items that enhance future campaigns.

Getting started with ASP OL Media email analytics is easy. We review your current email marketing setup to understand the data you are already collecting and where you are missing out. Then we implement proper tracking across all required platforms. Website analytics, ecommerce platform, email platform, and CRM—everything gets connected, so data flows properly.
Once tracking is set up, we establish baseline metrics. Where do your metrics currently stand? We need to know where we are starting from before we can measure progress.
Then we start tracking, analysing, and reporting on every campaign. You get crystal-clear insights into what is and is not working, and what to do next. Analytics are embedded into your email marketing strategy, not an afterthought.
Stop guessing and start knowing what your email marketing really does. Let us take care of your analytics and reporting.